
“The main purpose of the stock market is to make fools of as many men as possible.”
Bernard Baruch
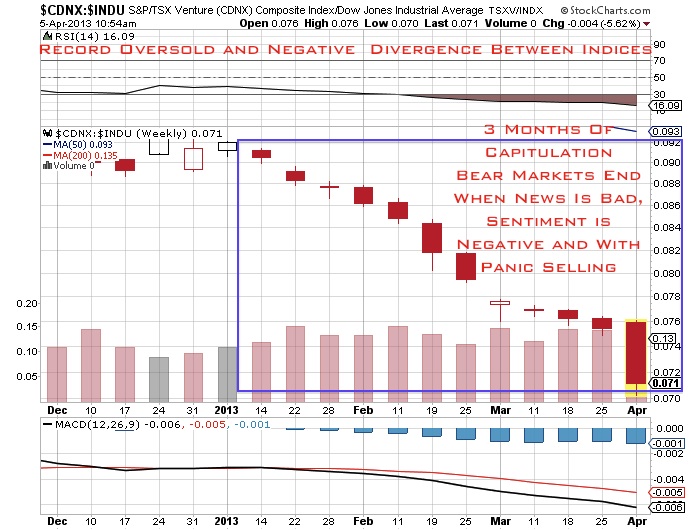
The majority of investors continue to chase the equity markets and U.S. dollar higher which both look very overbought. Despite these high priced, risky levels, gold, silver and platinum are testing strong areas of support and multi year lows.
The Venture is testing 2008 lows and near 2003 gold valuations of a ridiculous $400 an ounce. Don’t be fooled the majority of investors selling their resource shares for pennies on the dollar to chase the overbought equities, could be capitulating at exactly the wrong time.
The Venture is cheap priced at $400 au/oz. This is a ten year low testing 2003 levels. Gold is more than 50% higher than its pre credit crisis highs, the S&P 500 is now breaking through 2007 highs and the Venture is still discounted more than 70%. The Venture appears historically mispriced and discounted indicating its buying time for long term value investors, not selling time.
Read the rest of the article by clicking here…
Investors unsure of which way to turn in this market need only watch the “smart money,” says Jeb Handwerger, the editor and publisher of GoldStockTrades.com.Billionaires like John Paulson and Carlos Slim are plucking up mining investments on the cheap. In this interview with The Gold Report, Handwerger shares his favorite discount buys.
The Gold Report: Gold recently witnessed some upside price support after the Cypriot parliament proposed taking money from private bank accounts to raise the €5.8 billion needed to qualify for an international bailout. What was your first reaction to that news?
Jeb Handwerger: Any confiscation of bank accounts would just highlight what I have been saying for a long time—savers are losing money in their banks. Bank deposits are supposed to be a safe haven. Investors are going to seek out alternative hedges against the deterioration of currency and financial repression worldwide. This isn’t just happening in Cyprus, but all over the world where there are citizens losing money in their banks and are experiencing negative real rates. Investors need to look for the assets that will protect and grow their wealth in case public policies continue to destroy wealth and savings.
TGR: How does this differ from what happened in Greece?
Read more of Jeb’s interview by clicking here…
In theater a farce is a comedy that uses disguises, costumes and ruses to make believe unlikely scenarios. Over the past couple of years, we may have witnessed this bizarre script play out in the energy sector.
For awhile, one common misbelief among investors has been that fracking is the panacea that would solve the world’s energy problems. Many investors have incorrectly ignored the coal and nuclear sector as a viable alternative.
However, for many months I warned my readers to be careful of what you read. Natural gas is historically volatile and that coal and nuclear is crucial for modern industrial nations to utilize in their energy mix.
Natural gas is now breaking the $4 barrier and appears to be headed higher as supplies are tight due to increased demand and limited production. There is also increasing opposition to fracking especially on groundwater contamination.
Read the full article by clicking here….
You have to buy when there’s blood in the streets and real value. That’s when you have to step in and pick up the bargains. One should fight the crowd when you see value and learn to wait. To paraphrase Jesse Livermore, money is not made in the buying or selling, but in the waiting.
Many investors are chasing the latest trend hitting new highs rather than doing their homework and finding discounted opportunities that are trading close to liquidation levels. Look at discounted opportunities, study the fundamentals and invest in bargains. Stay away from chasing sectors that are overbought with questionable fundamentals. Be careful of analysts who recommend stocks at 50 times earnings and ignore companies that are trading below book value or cash value.
The junior market and the Toronto Stock Exchange Venture had a considerable downtrend since the beginning of 2011. A downtrend like this creates a fear that this will never end, and this ultimately becomes the consensus among investors. But one has to really think rationally during these periods of extreme pessimism.
Read more by clicking here…
Is The Junior Potash Sector Hitting Rock Bottom?
Population growth combined with potential inflationary effects could lead to increased demand for food. Increasing populations with declining arable land per capita will force farmers to boost yield using the key ingredient potash.
Potash or potassium salts are amazing fertilizers. They make the plant stronger and improves output. Potash helps the physical condition of the crop boosting vitality. It helps a plant’s immunity to withstand drought, infection and parasites. Do not forget that potash is also used in drilling, building materials, paper, pharmaceuticals and other products.
Continuing interest especially out of Asia, India and Brazil for a secure long term supply could boost global demand to 75 million tons by 2020 and boost the need for junior potash developers. These countries have major supply demand imbalances.
The global population increases 300-400 million people every five years. Rising emerging economies require more well rounded diets consisting of higher meat based and crop intensive diets.
Arable land is declining per capita and this means farmers will need to boost yields. US imports 90% of what it consumes and only produces 1 million tons a year. Domestic agricultural giants may need to secure a domestic supply of potash.
Read full article by clicking here…
I have just returned from PDAC, the largest mining show in the world where I was invited to be a speaker. This is my second year presenting at the show which is attended by over 30,000 people from all over the world. It is a great honor and privilege to be selected by the highly prestigious PDAC committee. Only two years ago, the sentiment was completely different. In 2011, the mood was euphoric and may have marked the top in the junior mining sector. This year the sentiment was negative and may be marking a capitulation and major bottom.
The theme this year at the conference was that explorers and developers are having a difficult time raising capital as investors chase the overbought Dow and Nasdaq which is hitting record levels and making multi-year breakouts. Surprisingly, this is at a time when the gold and silver miners are hitting multi-year lows despite gold and silver holding the $1500 and $26 area. I expect support for gold and silver to hold as the equity markets are overbought and our sectors look to rebound off of these oversold levels.
Read the full article by clicking here…
A self-proclaimed long-term contrarian, Handwerger targets undervalued sectors with great long-term growth potential — of which the uranium market is a prime example. While other commodities have made significant gains following the 2008 financial crisis, uranium prices are down about 70 percent from their 2007 highs — a situation brought on by a natural disaster, not poor fundamentals.
“Uranium is one of the few commodities still heavily discounted compared to other commodities. The mispricing of the sector can largely be attributed to a lack of understanding — on the part of many investors — of the overall global fundamentals that are involved in the uranium sector,” said Handwerger. He believes governments, utilities and big-money investors are beginning to come around to the reality that nuclear power will be a part of the modern, global, industry-based economy, especially in Asia.
Read the full article on the uranium miners by clicking here…
The trend towards resource nationalism is taking a major toll on the potential supply of platinum. Simultaneously, auto sales are rebounding to levels not seen since before the credit crisis in early 2008.
Despite global supply concerns, increase of resource nationalism and rising industrial and automobile demand, platinum is still undervalued compared to gold and are far below pre credit crisis highs. This may be a short term phenomenon and over the long term PGM’s may provide a great buying opportunity and outperform gold.
Read the full article by clicking here…
